NICHOLAS HINKEL / PORTFOLIO 2026

Data withpurpose.✳

I’m a mathematics student focused on data science. I use statistics, code, and visualization to find patterns and explain what they mean.
Portrait of Nicholas HinkelNICK HINKEL · AUSTIN, TX

Finding patternsin data.

I’m a mathematics student at UT Austin, pursuing a minor in Statistics & Data Science and a certificate in Programming & Computation.

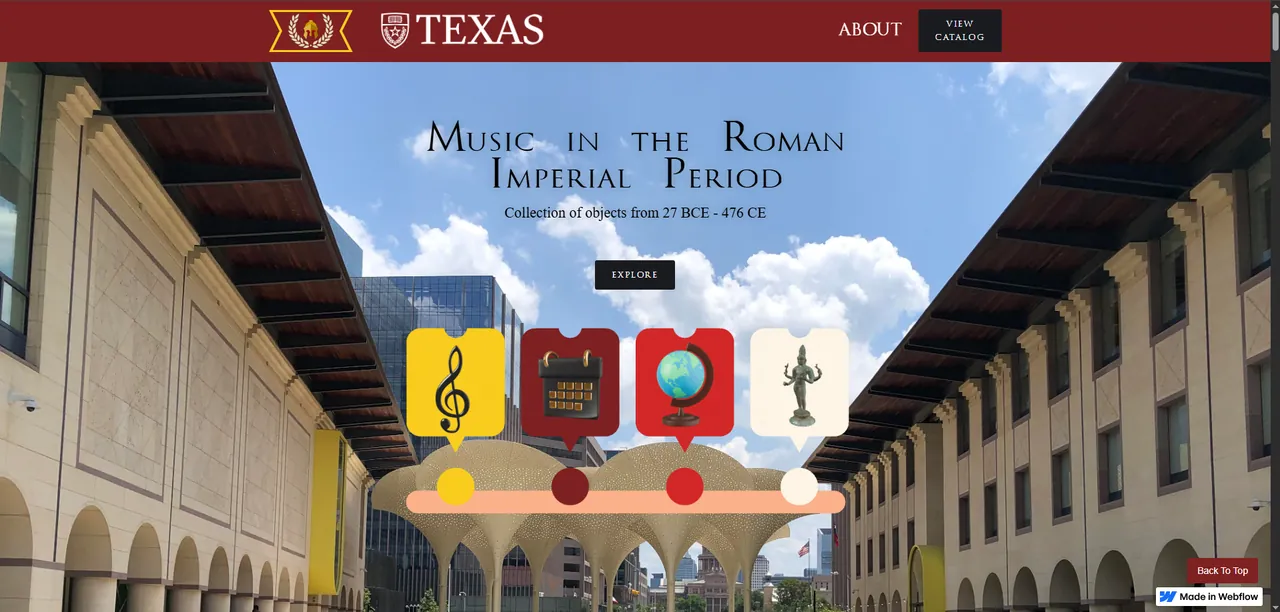
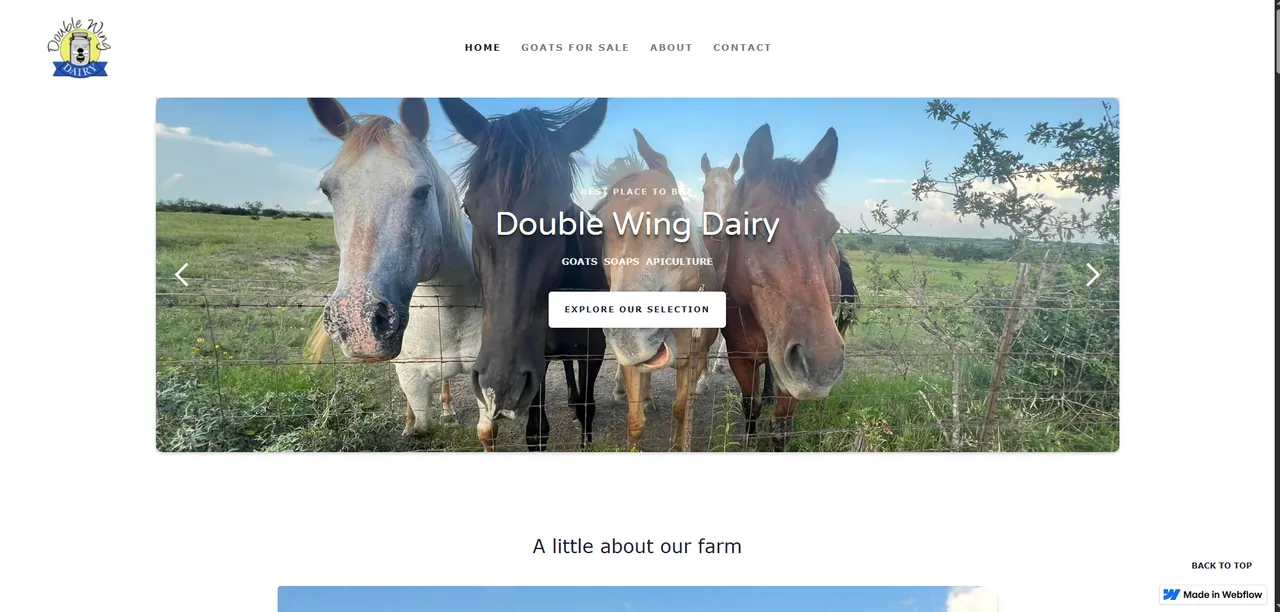
I work with data from the first question through the final result: building datasets, writing SQL and Python, testing models, and creating visualizations that make findings easier to explore. My CS2 and wildfire projects show that process in action. I also build websites, which you can explore below.

See data projects
01 / 06

DATA ANALYTICS · COUNTER-STRIKE 2

CS2 Dashboard

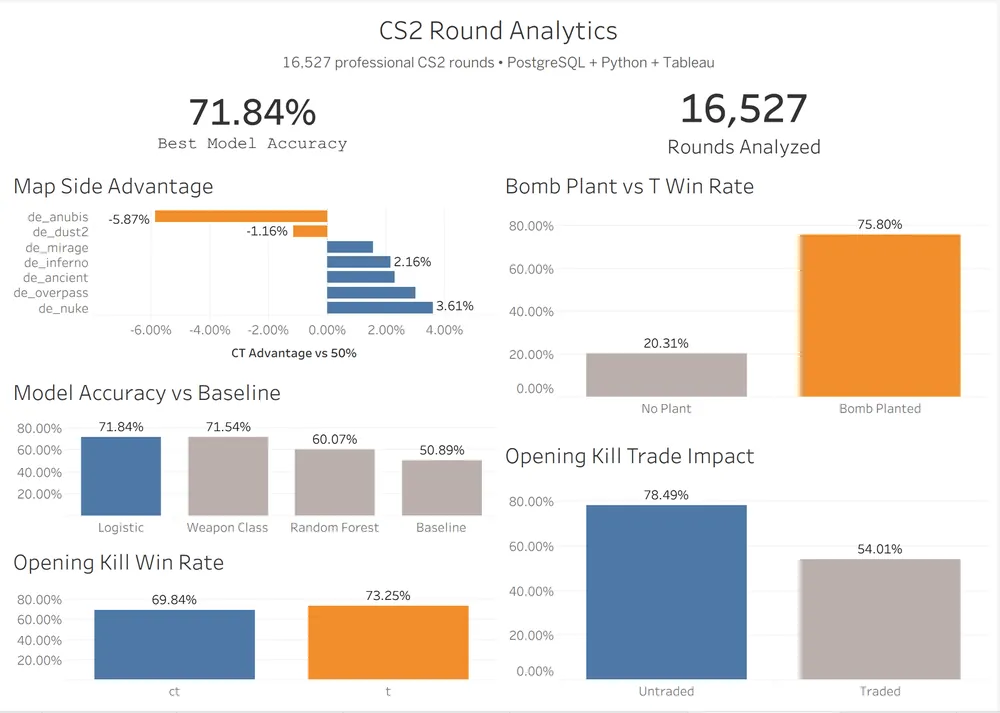
An analytics pipeline for professional Counter-Strike 2 rounds, taking raw Parquet data through PostgreSQL and Python into a Tableau dashboard. It explores map advantage, opening kills, bomb plants, trades, and match outcomes.
PostgreSQLPythonTableau
Screenshot of CS2 Dashboard
Try the round winner predictor
02 / 06

STATISTICAL ANALYSIS · SDS 320E · IN PROGRESS

CS2 Round Duration Study

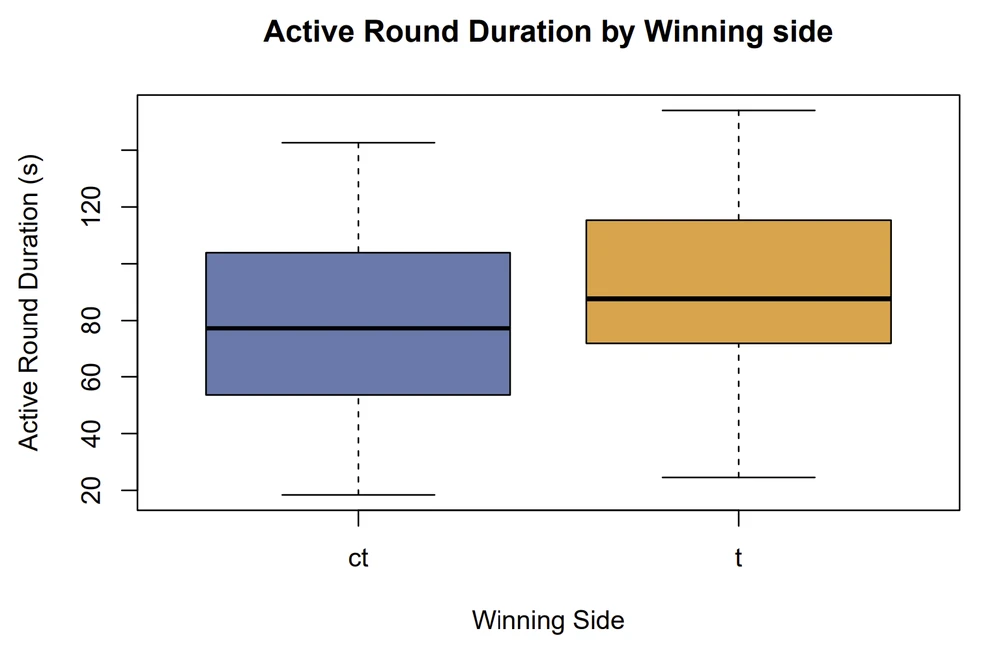
An R-based study of how active round duration relates to the winning side and the timing of the opening kill in Counter-Strike 2. The descriptive analysis uses distributions, comparisons, and visualizations to explore patterns in match data.

RStatisticsData visualization
Screenshot of CS2 Round Duration Study
03 / 06

DATA VISUALIZATION · MACHINE LEARNING

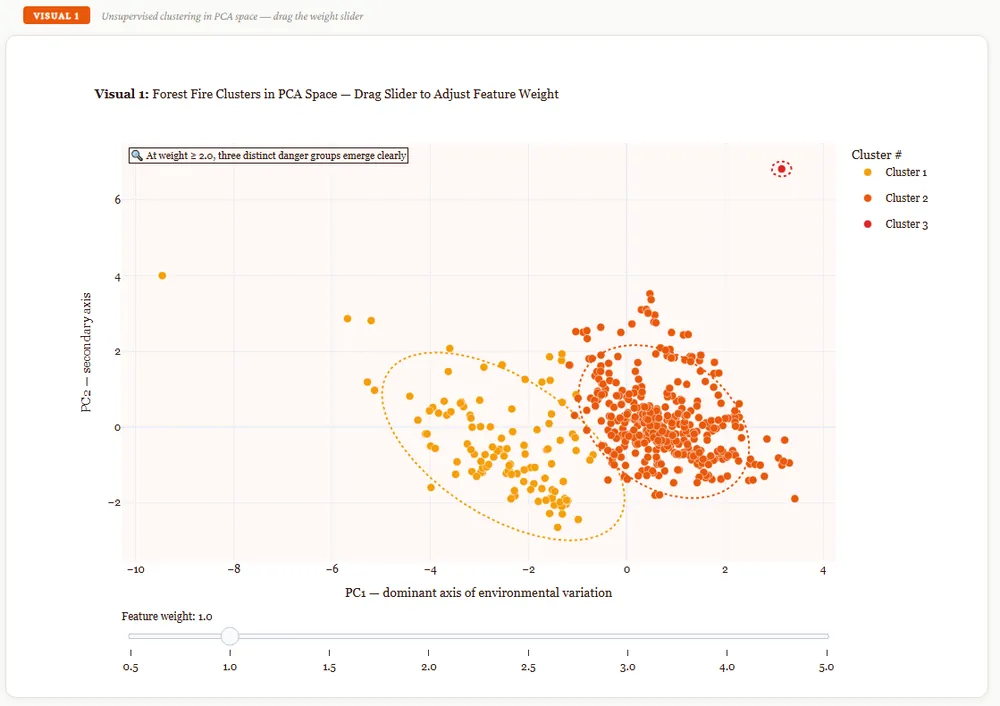
Wildfire Severity Dashboard

Exploring the relationship between environmental conditions and burned area in Montesinho Natural Park, Portugal. The dashboard compares features, clustering, model results, and feature importance.

PythonData visualizationRandom forest
Screenshot of Wildfire Severity Dashboard
04 / 06

INTERACTIVE DATA · THE ODYSSEY

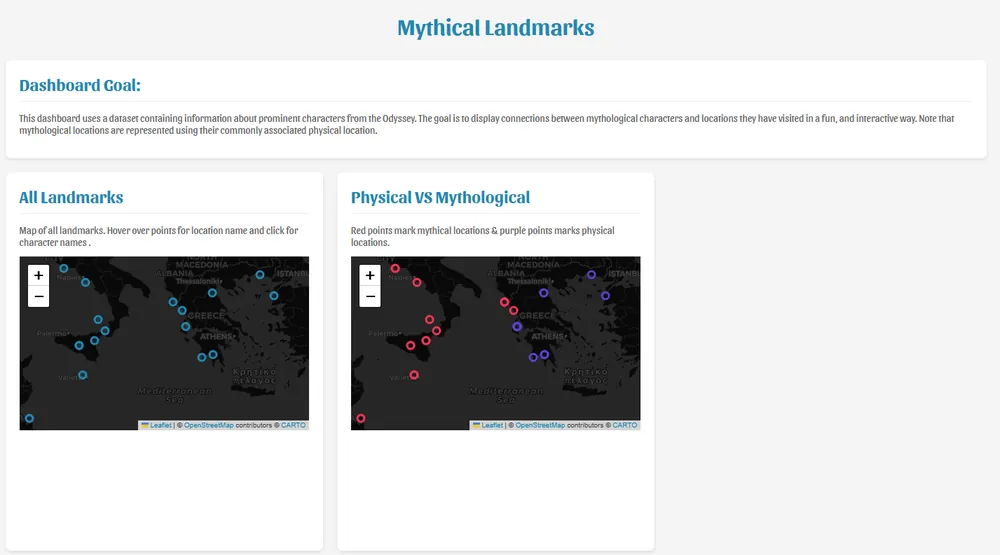
Mythology Dashboard

A hand-built dataset connects prominent characters and places from the Odyssey. Interactive maps, a character network, and an animated journey make the relationships explorable.

PythonMappingNetwork graph
Screenshot of Mythology Dashboard
05 / 06

WEB AUTOMATION · CONTENT SYSTEM

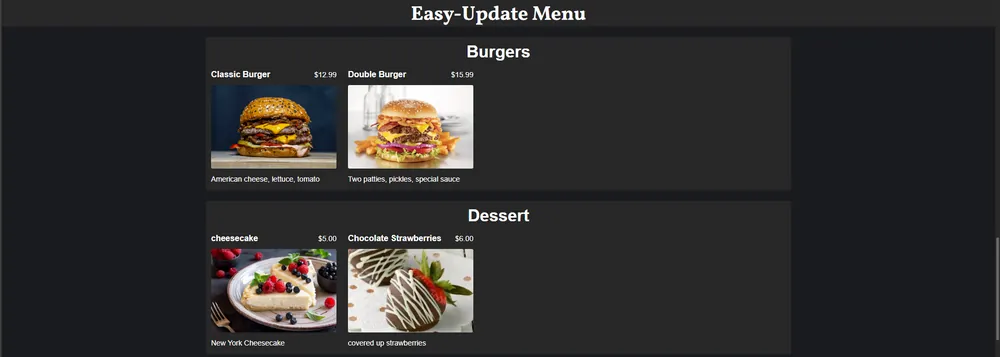
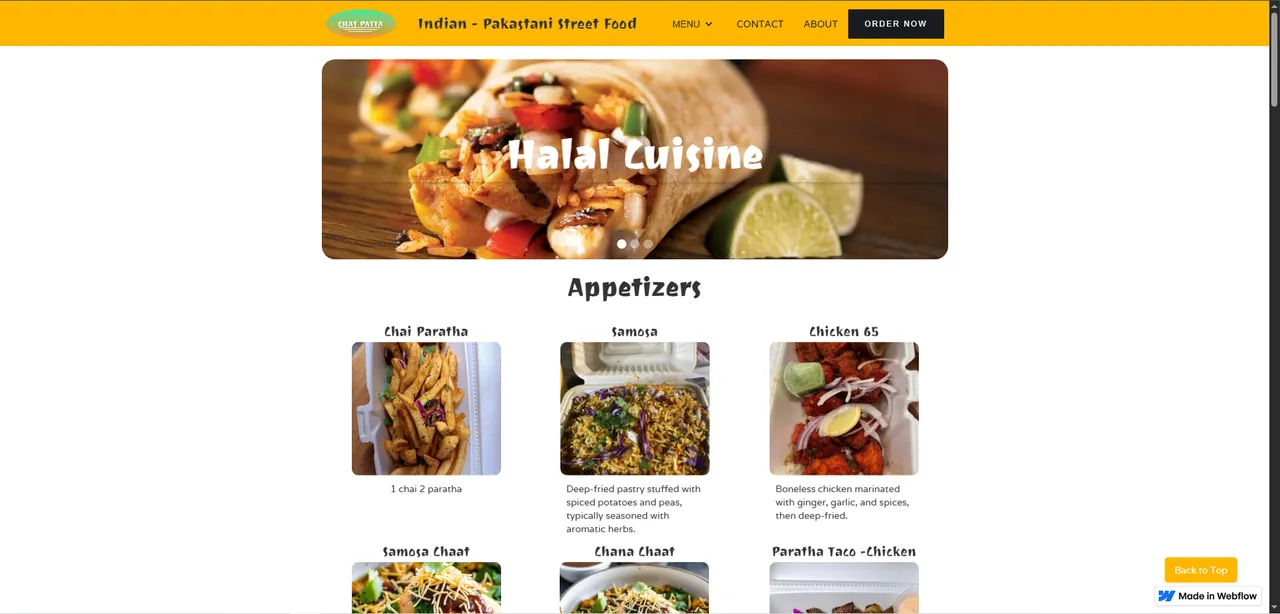
Easy-Update Menu

A menu workflow linking Google Sheets, Google Cloud, GitHub, and Webflow so a business can update its website from one spreadsheet.

WebflowGoogle SheetsGitHub
Screenshot of Easy-Update Menu
PROJECT
OVERVIEW
06 / 06

ENGINEERING · GROUP PROPOSAL

UTSA EM Monorail System

A proposal for an electromagnetic monorail across campus, including route planning, a SolidWorks model, a 3D printed maglev, and cost estimates.

SolidWorksResearch3D printing

EXPERIENCE

People &problem solving.

Nicholas Hinkel wearing his H-E-B uniform and name badge

H-E-B

Cashier · Leander, Texas

2022 — PRESENT

EDUCATION

Built oncuriosity.

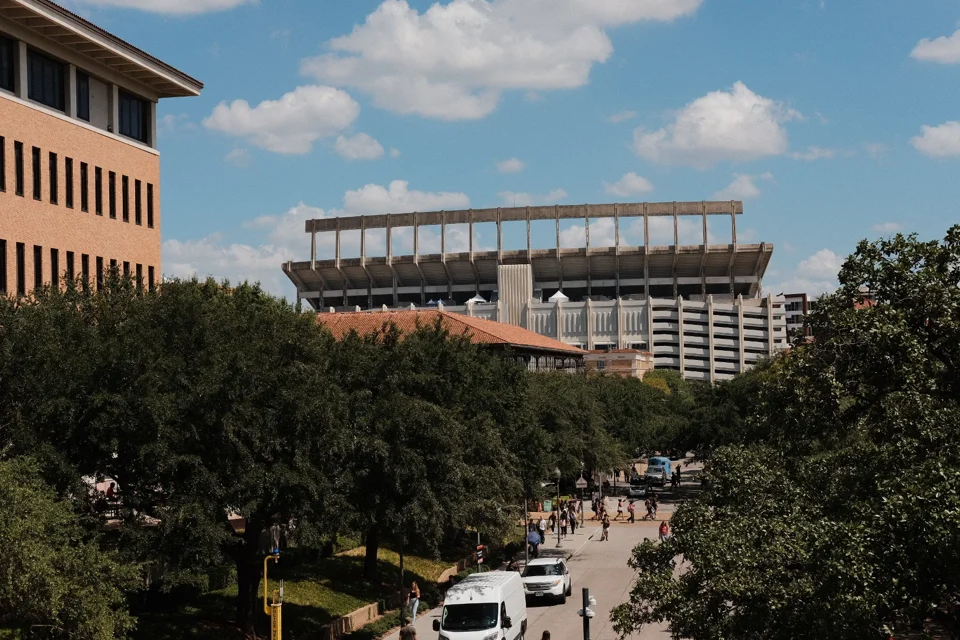
UT Austin campus with the football stadium beyond the trees

The University of Texas at Austin

BSA Mathematics · Statistics & Data Science minor · Programming & Computation certificate

EXPECTED 2027
Relevant coursework

Completed

  • Elements of Data Visualization CS 329E
  • Elements of Databases CS 327E
  • Linear Algebra and Matrix Theory M 341
  • Probability I M 362K
  • Elements of Software Design CS 313E

In progress · Fall 2026

  • Elements of Statistics SDS 320E
  • Elements of Software Engineering I CS 330E

Planned · Spring 2027

  • Elements of Data Analytics CS 329E
  • Elements of Data Science SDS 322E
  • Applied Statistics M 358K
  • Introduction to Real Analysis M 361K

University of Texas at San Antonio

Electrical Engineering studies

2023 — 2024

A different perspective.

Scenes, structures, and small details. A few photographs from my camera.
Drag or swipe to explore. Select a photograph for a closer look.

23 PHOTOGRAPHS · AN OPEN JOURNAL